Car Sales Performance Analysis with the Python Libraries Pandas, Matplotlib and Seaborn (on Open Data)
Goal
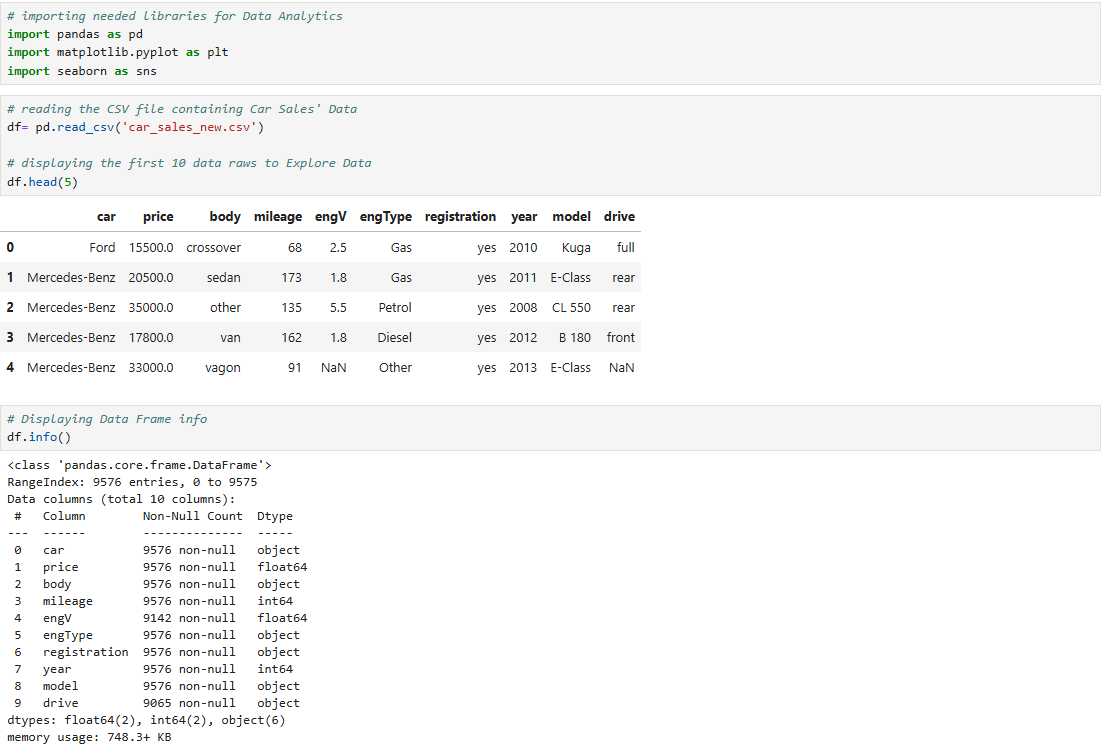
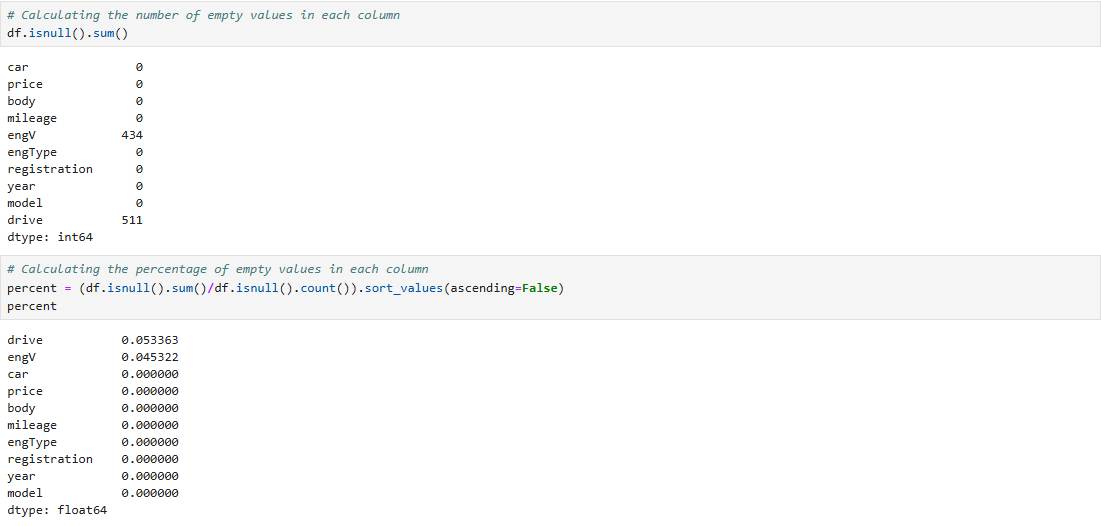
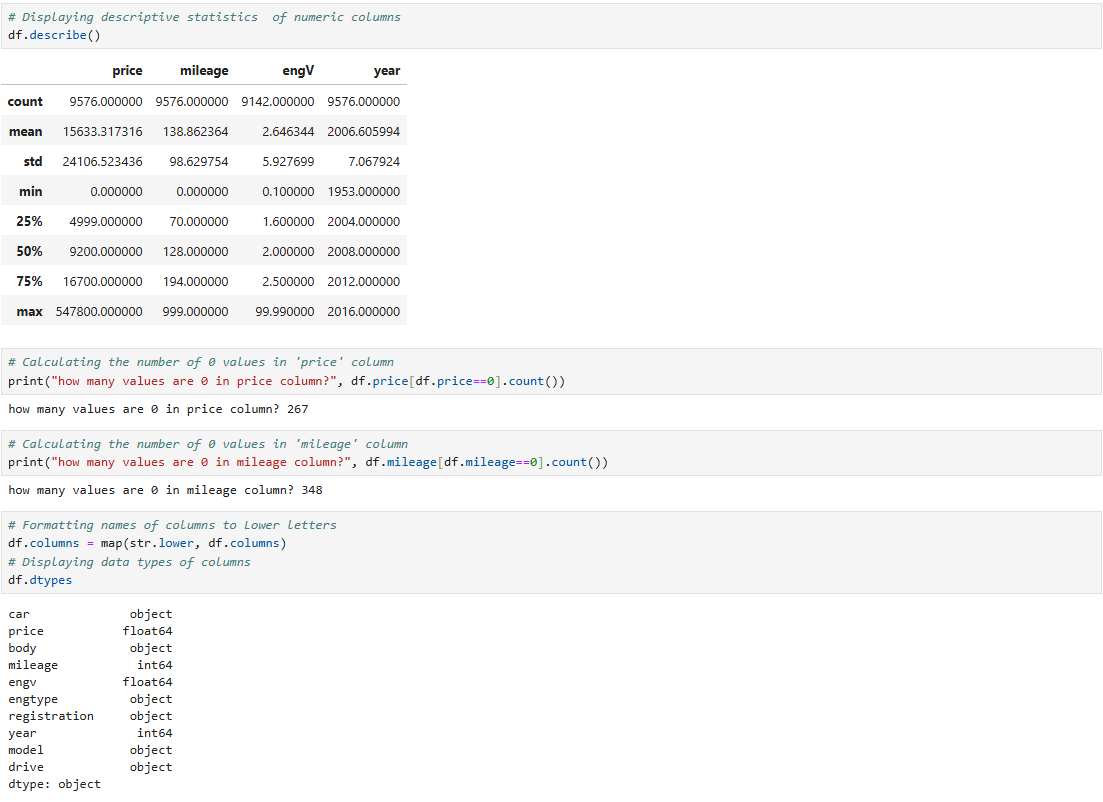
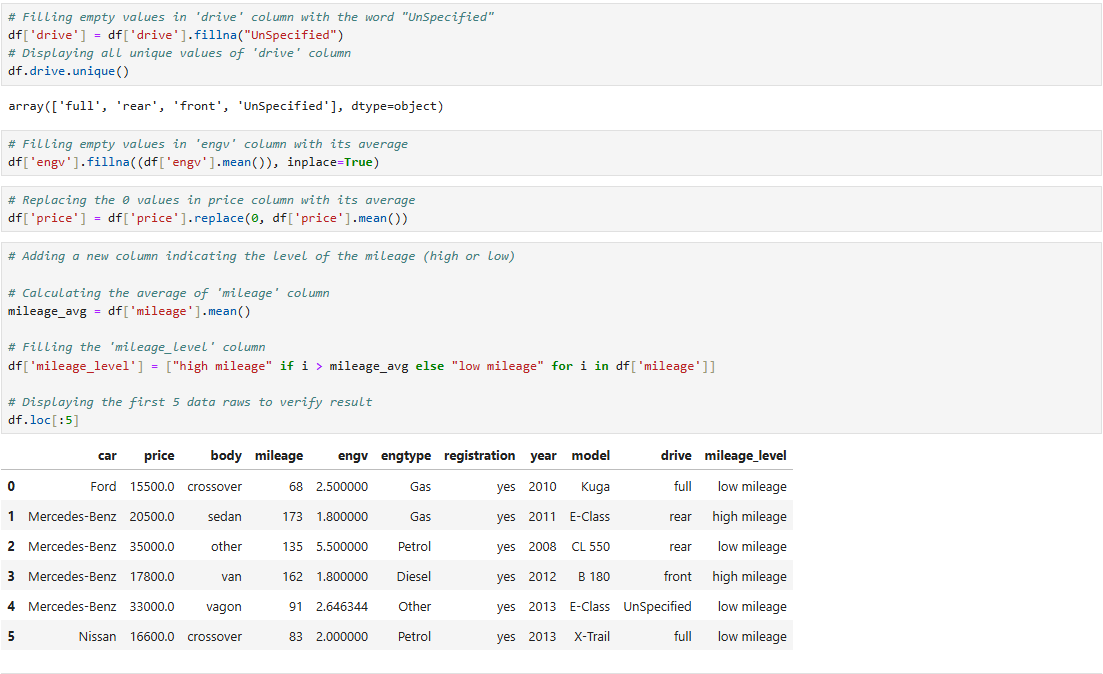
Analyzing in Detail Car Sales Performance (from open data), from DataProcessing and Cleaning to DataVisualization, with the Python libraries Pandas, Matplotlib and Seaborn.
Result
Several Visualization Charts (Histogrammes, Pie charts, Boxplots ect) analyzing in detail CarSalesPerformance:
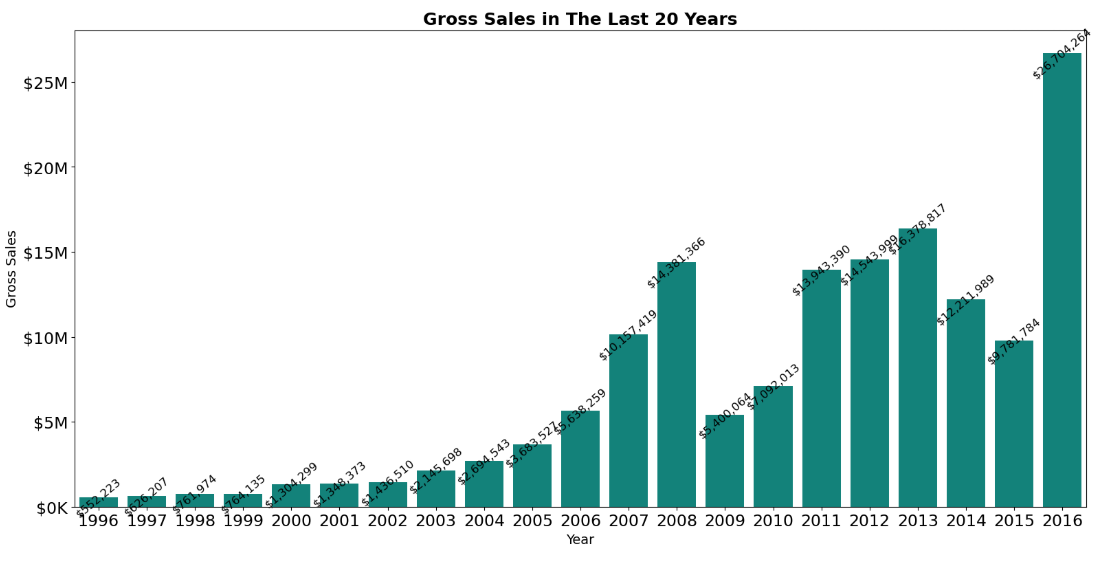
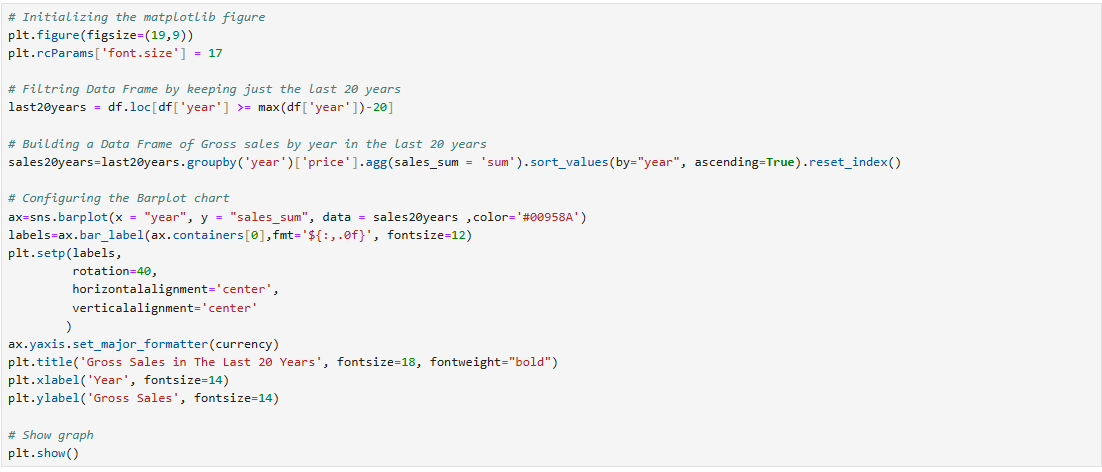
* Gross Salesin the last 20 Years
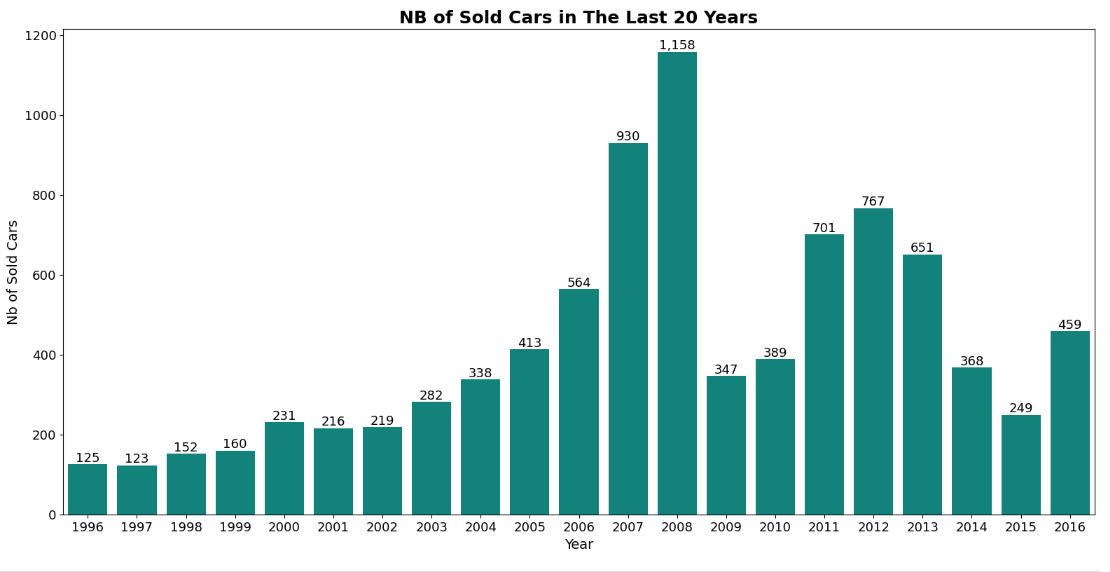
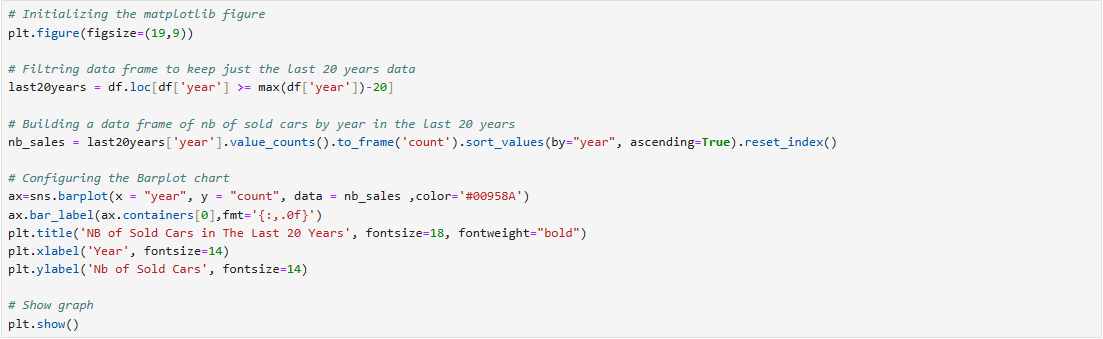
* Number of Sold Cars in the last 20 Years
* Average Price of Sold Vehicles by Body Type and Fuel Type
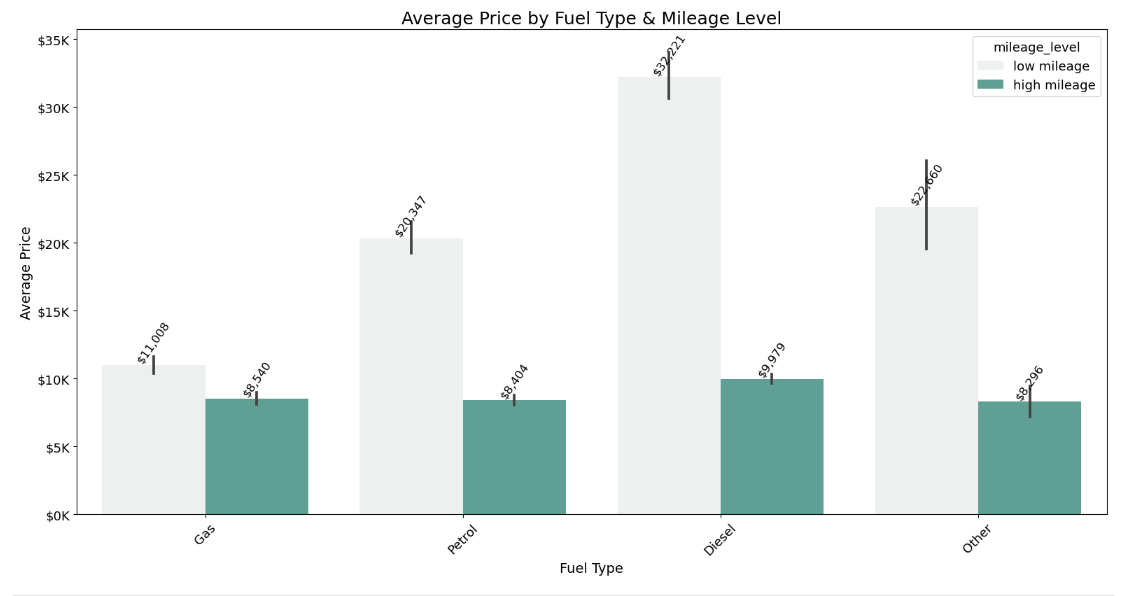
* Average Price of Sold Vehicles by Fuel Type and Mileage Level
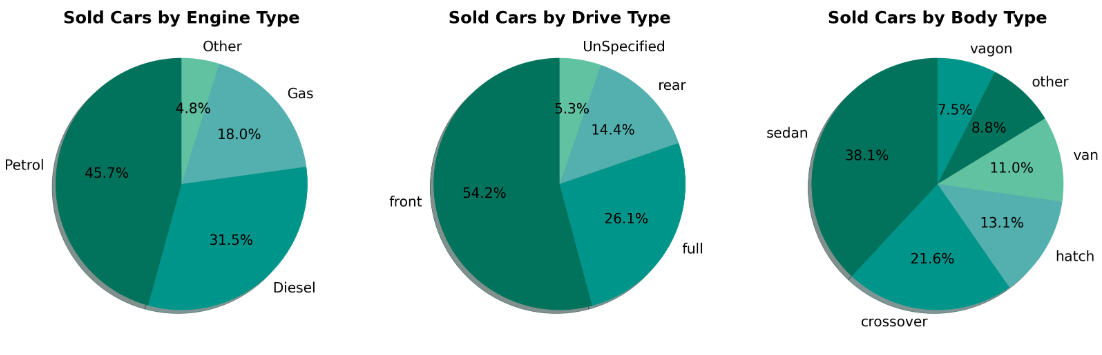
* Pie Chartson several Car SalesStatistics
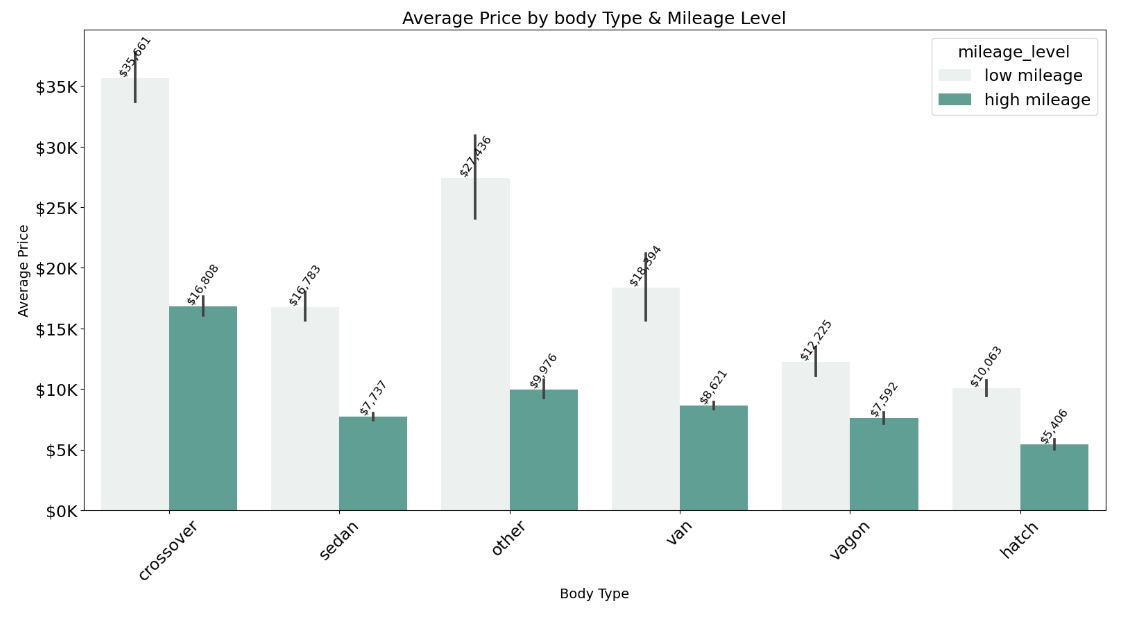
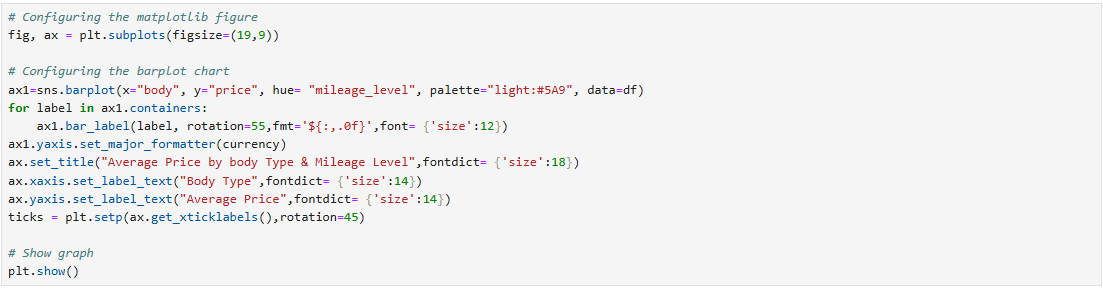
* Average Price of Sold Vehicles by Body Type and Mileage Level
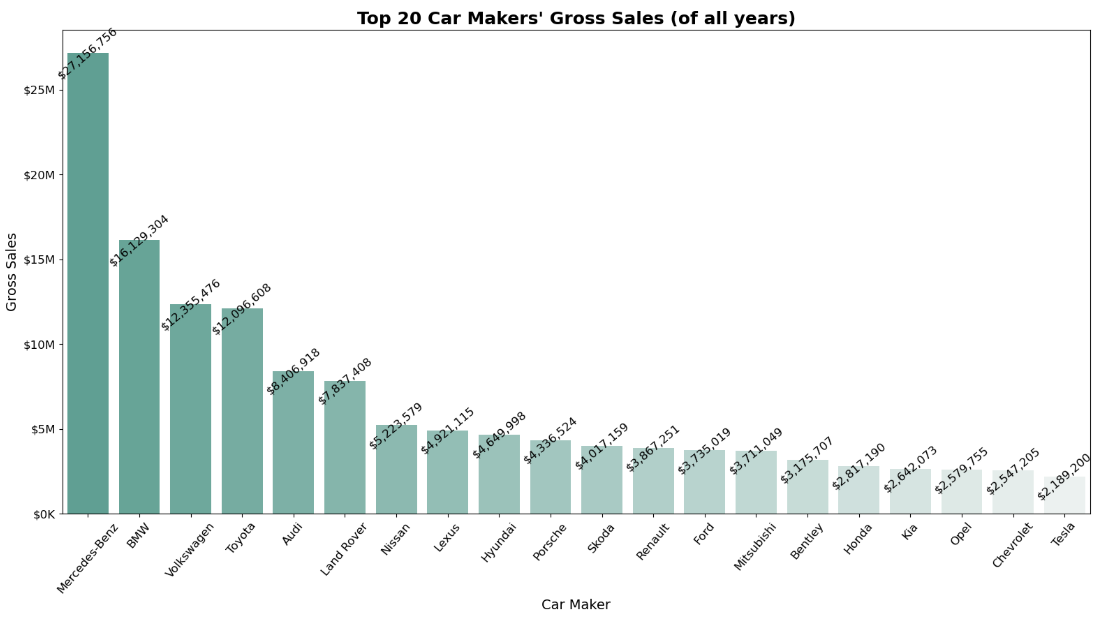
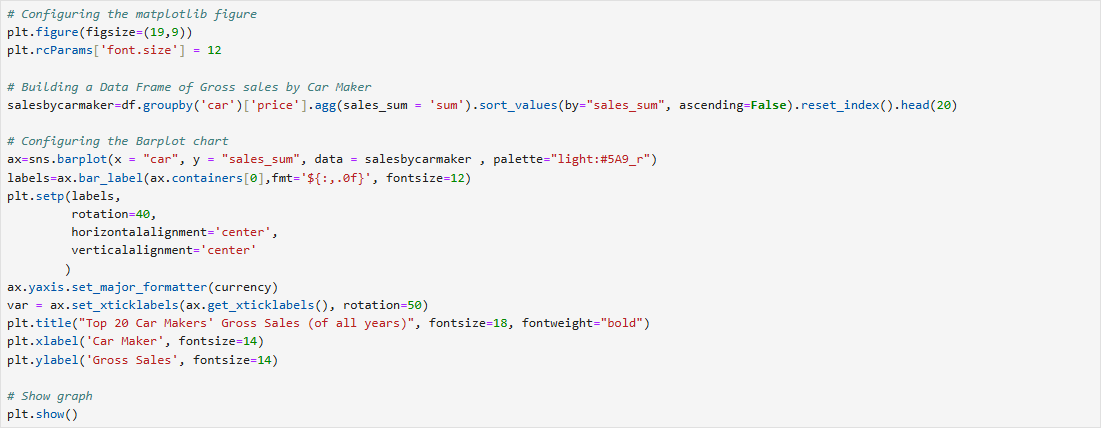
* Top 20 Car Makers‘ Gross Sales (in all years)
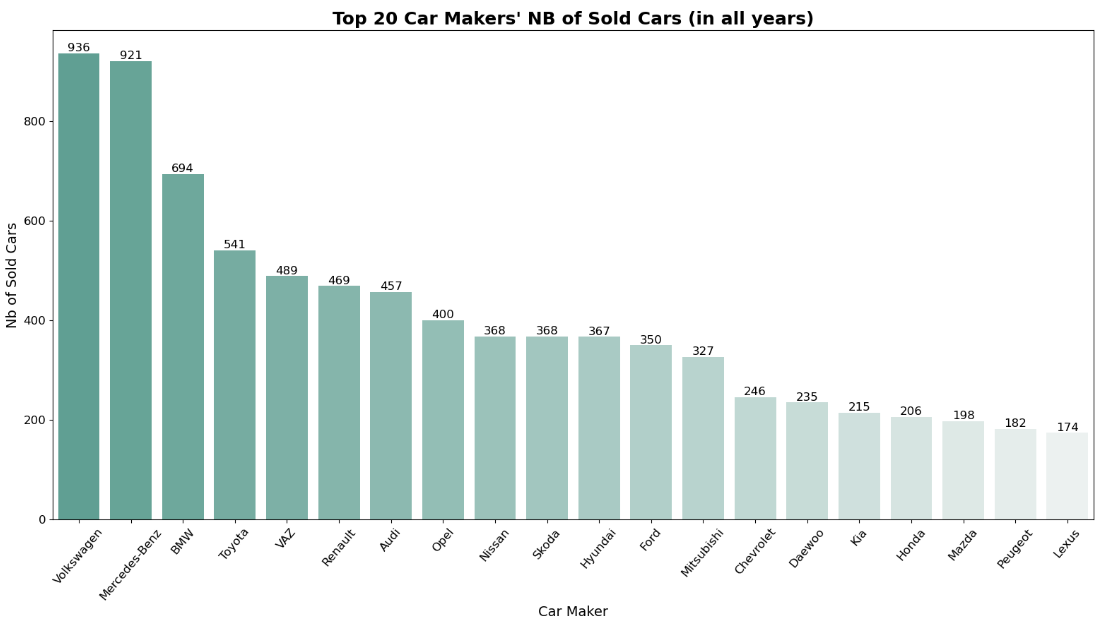
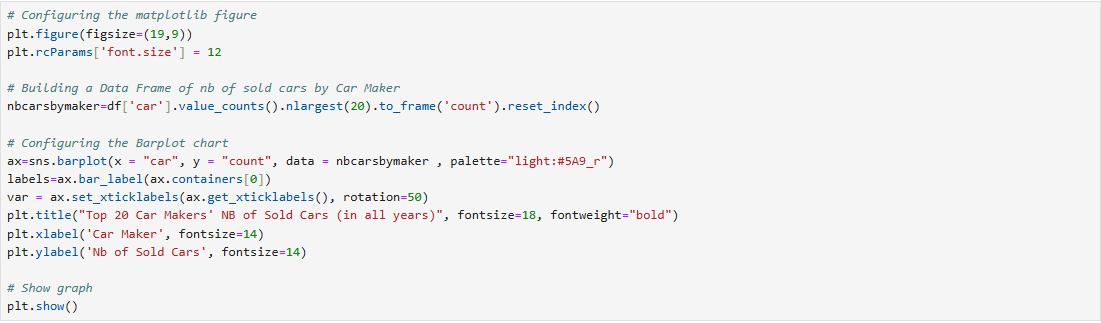
* Top 20 Car Makers’Number of Sold Cars (in all years)
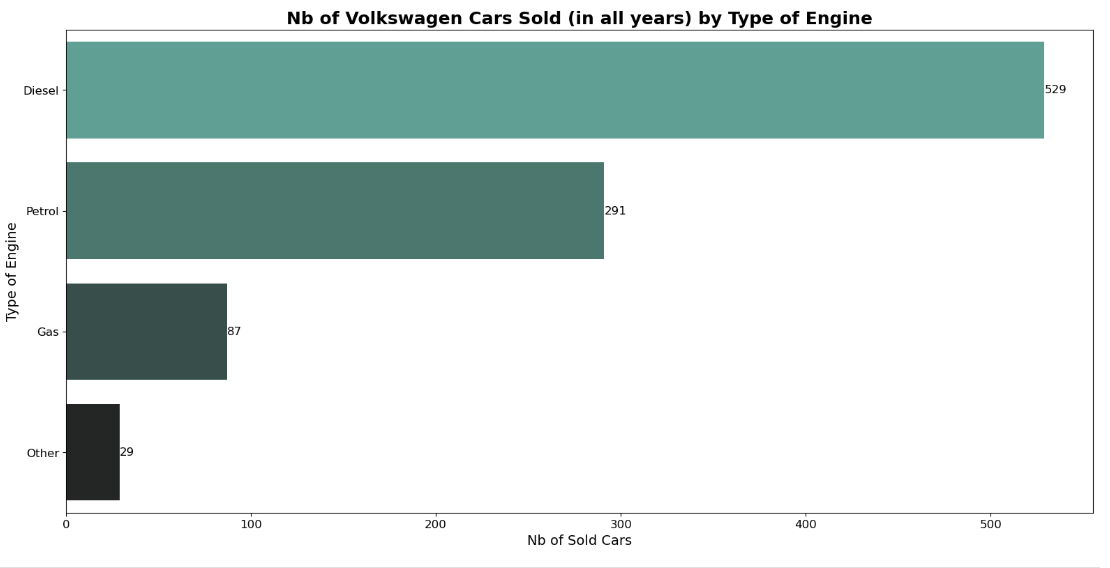
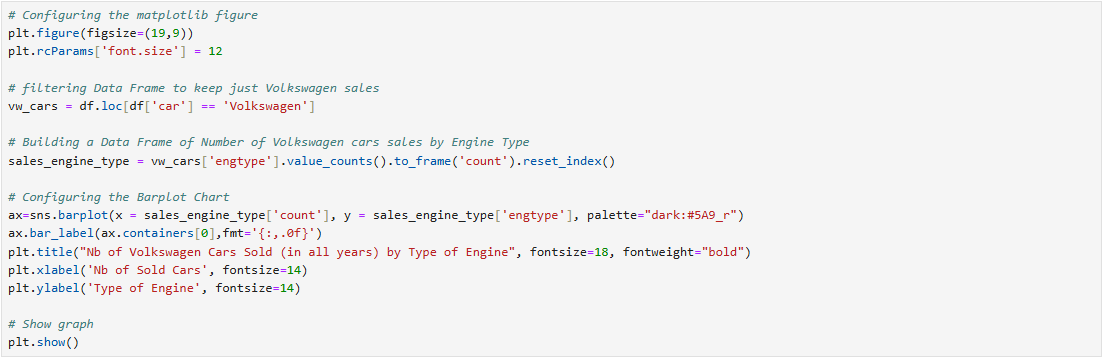
* Volkswagen’sNumber of Sold Cars (in all years) by Type of Engine
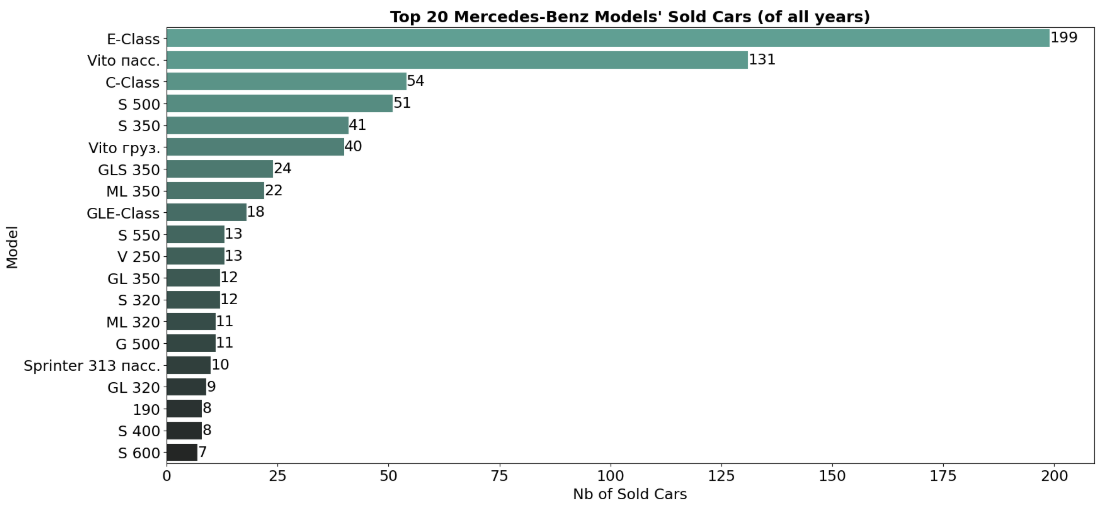
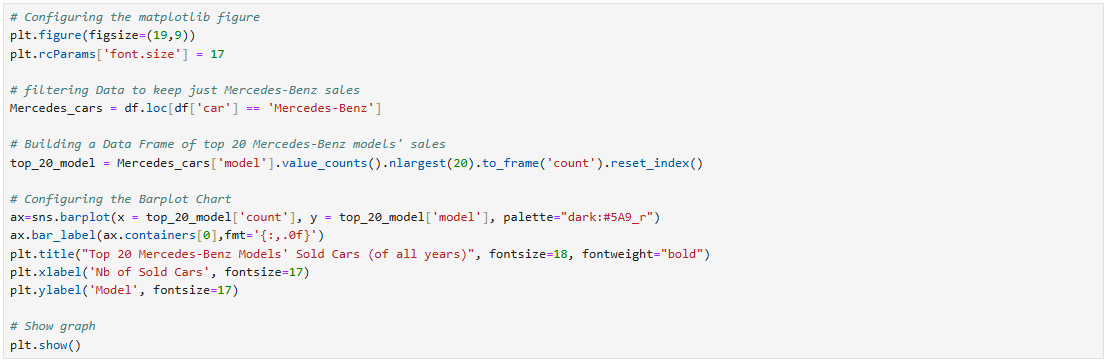
* Top 20Mercedes-Benz’sModels Sold (in all years)
Ect.
Examples of the work done
Sales Performance in the last 20 Years
Number of Sold Cars in the last 20 Years
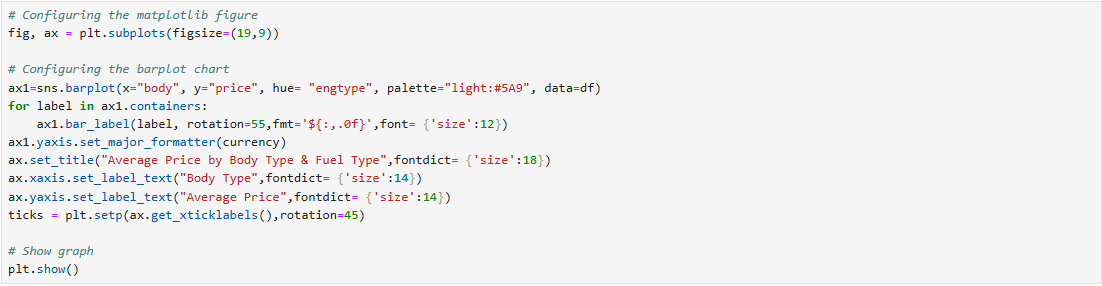
Average Price of Sold Vehicles by body Type and Fuel Type
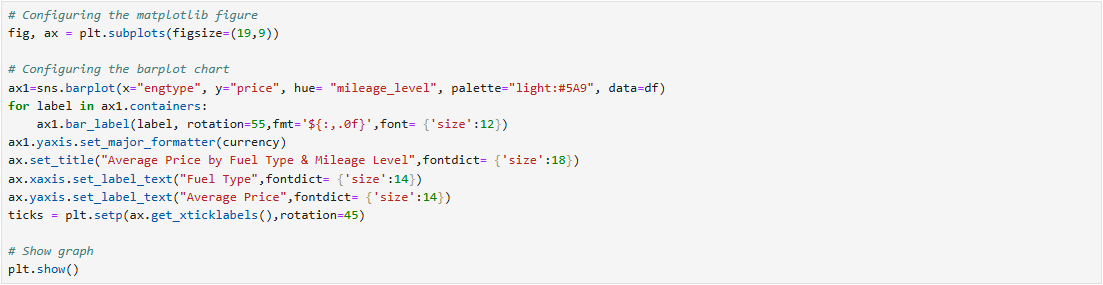
Average Price of Sold Vehicles by Fuel Type and Mileage Level
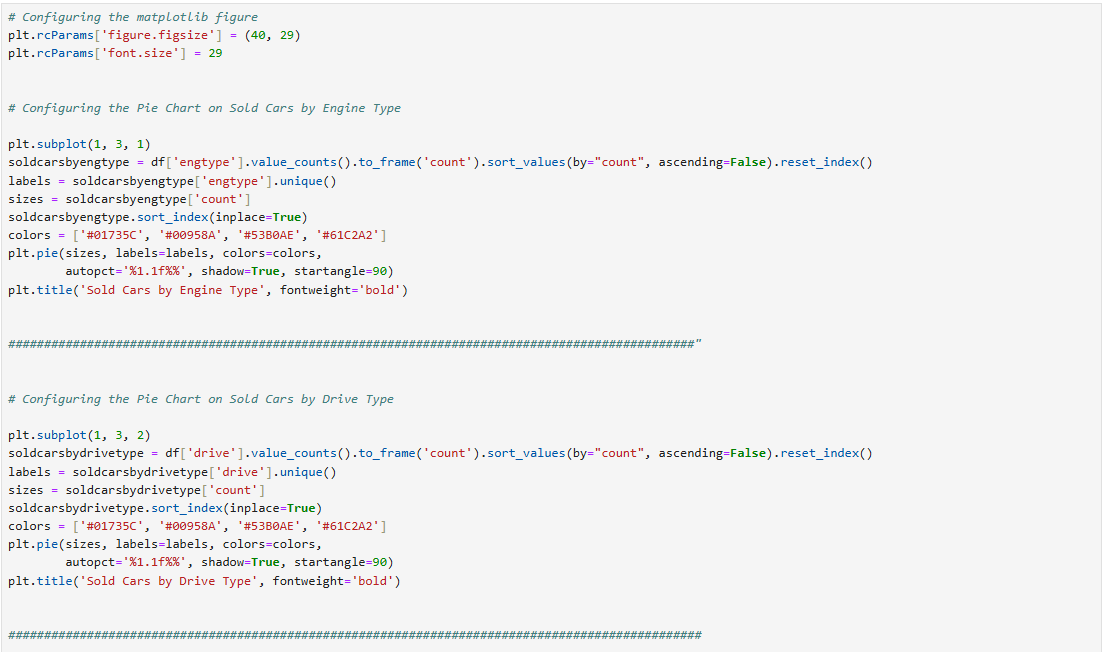
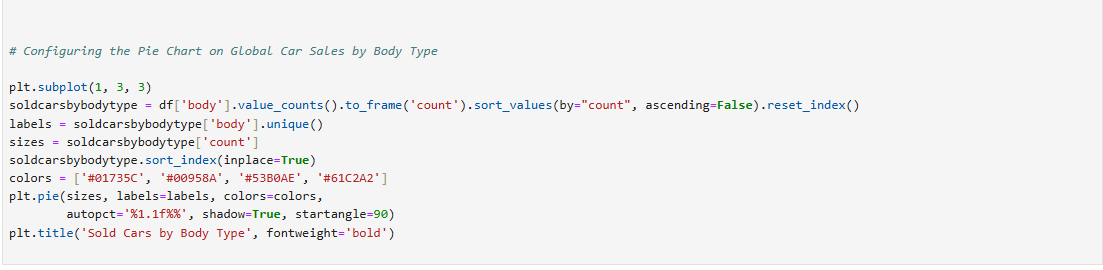
Pie Charts on several Car Sales Statistics
Average Price of Sold Vehicles by Body Type and Mileage Level
Top 20 Car Makers' Gross Sales
Top 20 Car Makers' Number of Sold Cars
Volkswagen's Number of Sold Cars (in all years) by Type of Engine