Students Performance Analysis with the Python Libraries Pandas, Matplotlib and Seaborn (on Open Data)
Goal
Analyzing in Detail Students Performance (from open data), from DataProcessing and Cleaning to DataVisualization, with the Python libraries Pandas, Matplotlib and Seaborn.
Result
Several Visualization Charts (Histogrammes, Pie charts, Boxplots ect) analyzing in detail all students statistics:
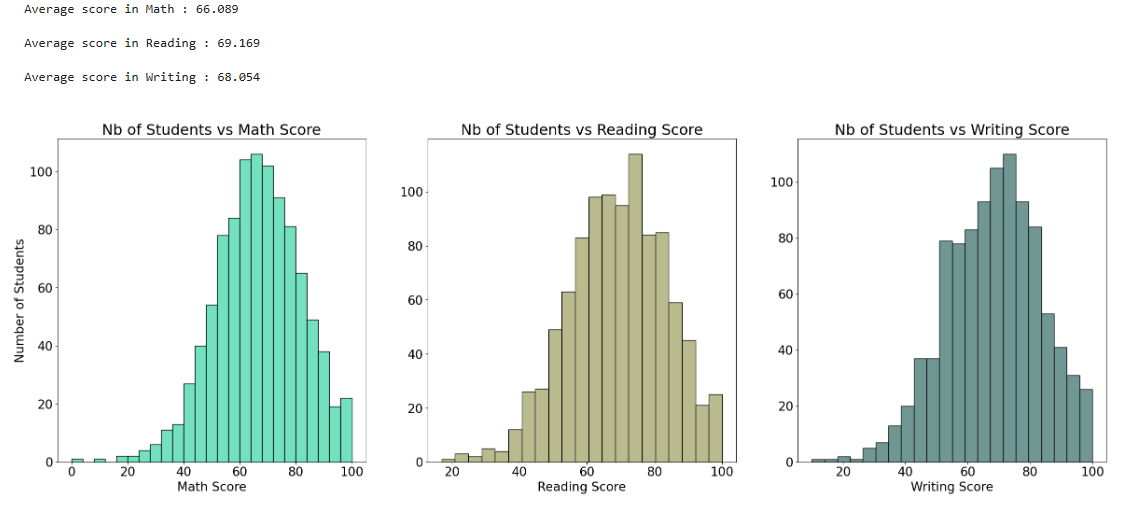
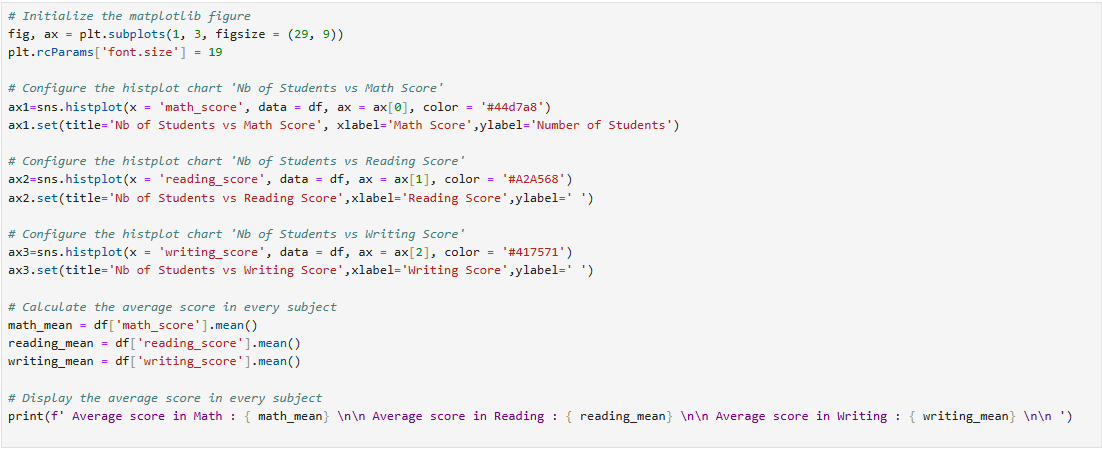
* Number of Students by each Subject Score
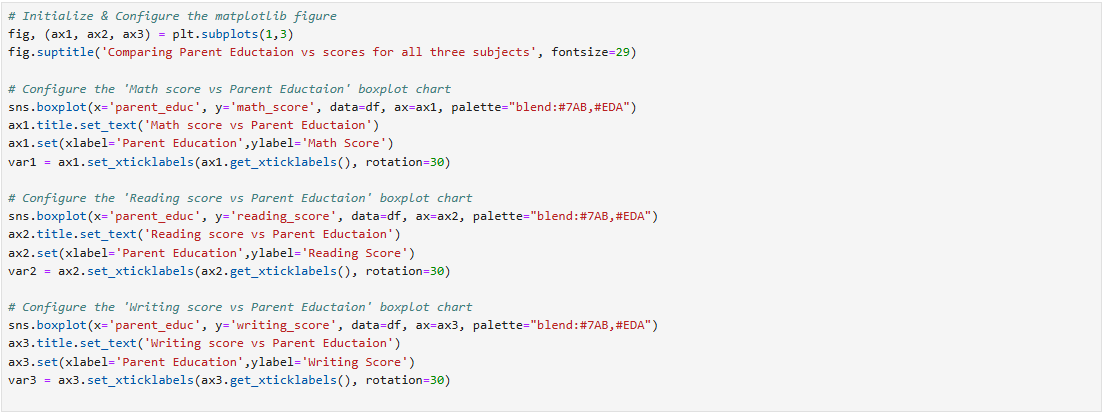
* Students Scores vs Parent Educationfor all 3 Subjects
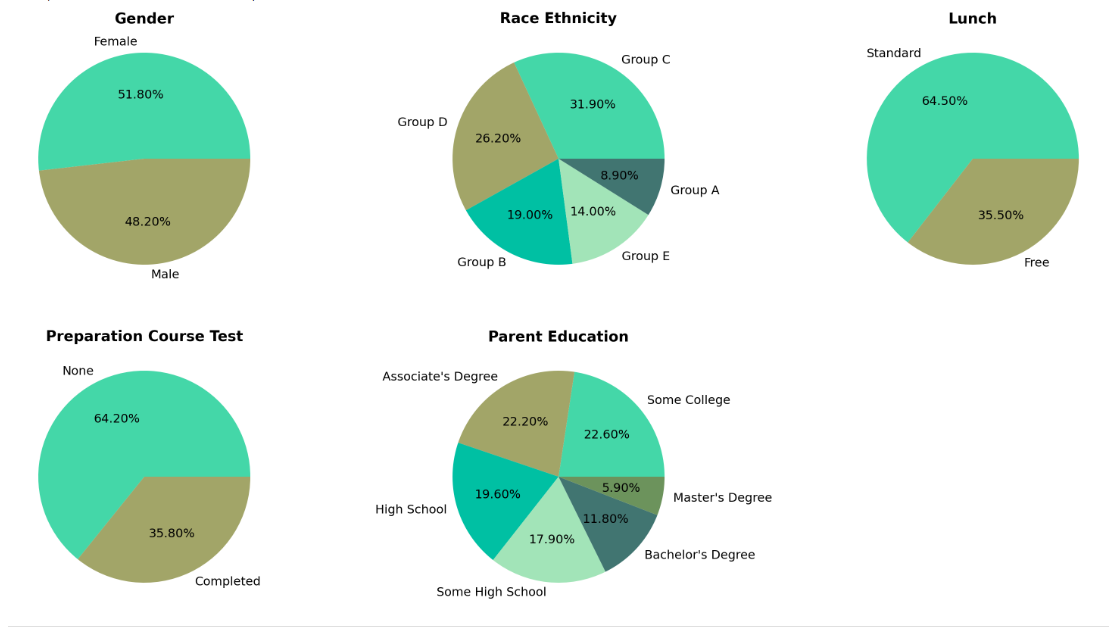
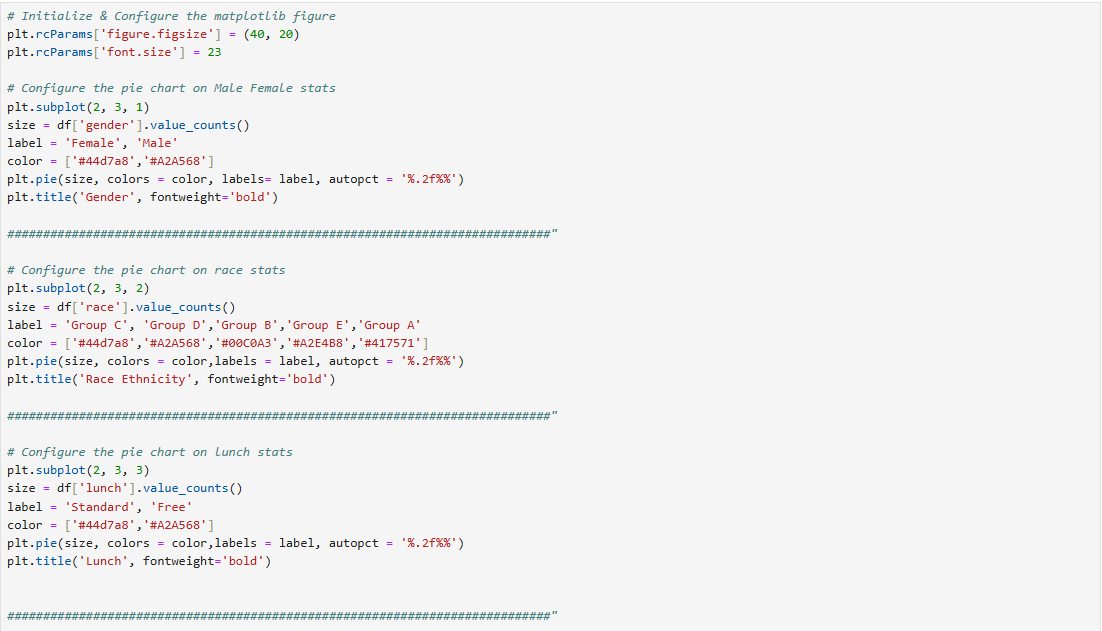
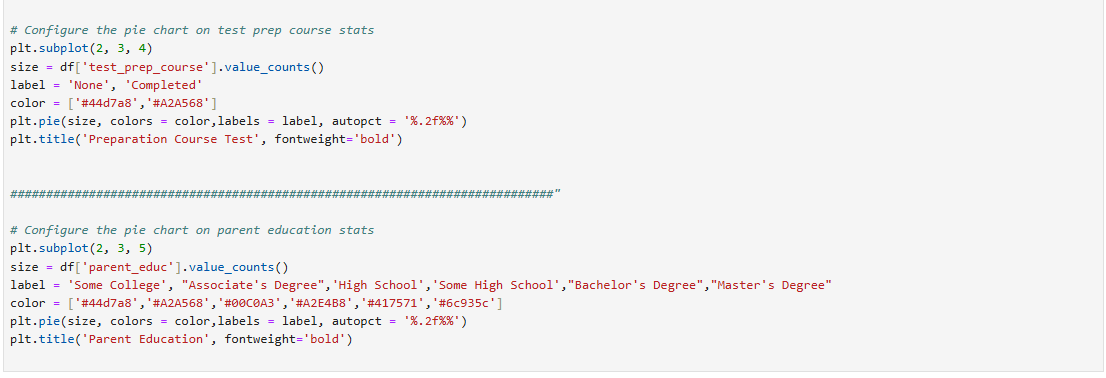
* Pie Chartson several Students Statistics
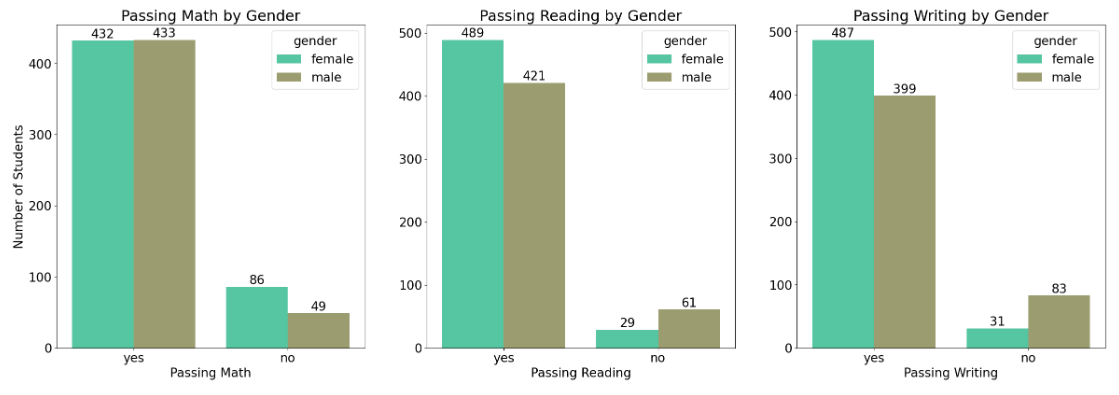
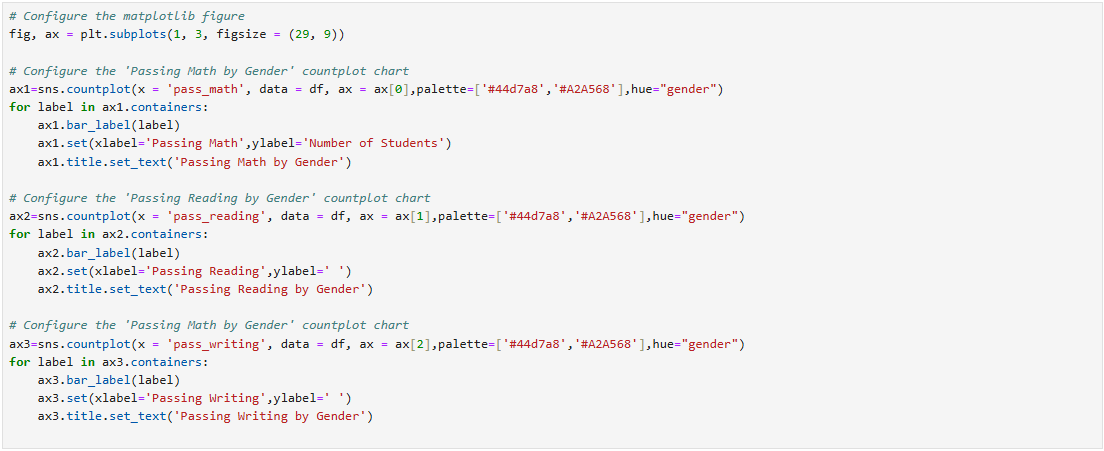
* Number of Students by GenderPassing each Subjects
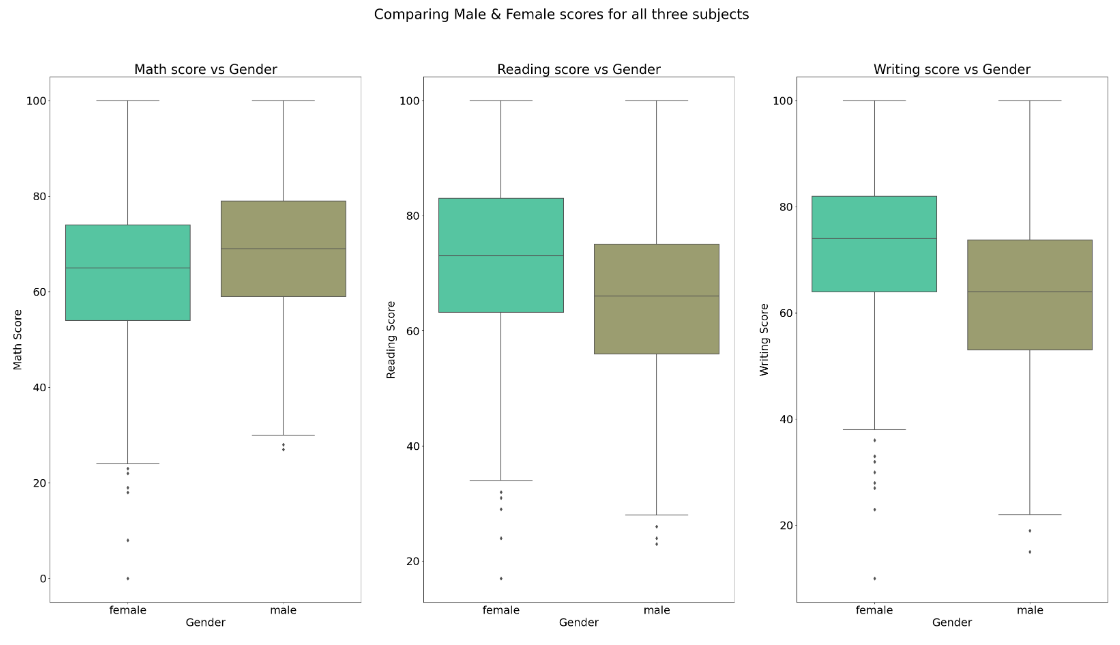
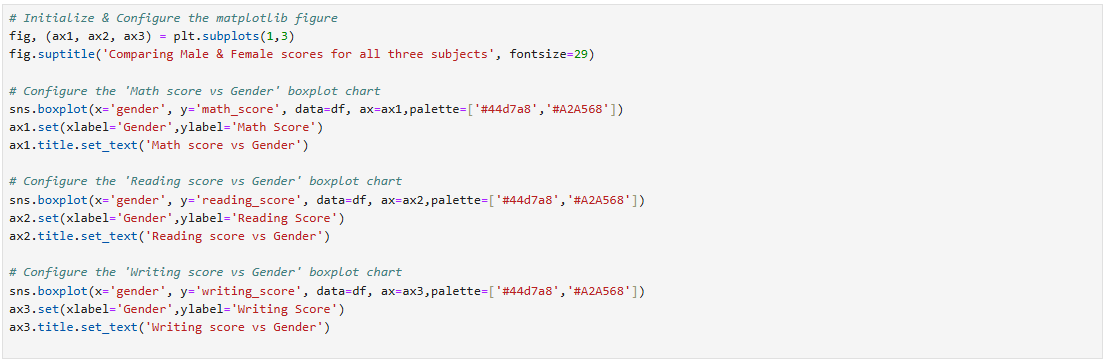
* Male and FemaleScores for all 3 Subjects
Ect.
Examples of the work done
Number of Students By each Subject Score
Students Scores vs Parent Education for all 3 Subjects
Pie Charts on several Students Statistics
Number of Students by Gender Passing each Subjects
Male and Female Scores for all 3 Subjects
Details
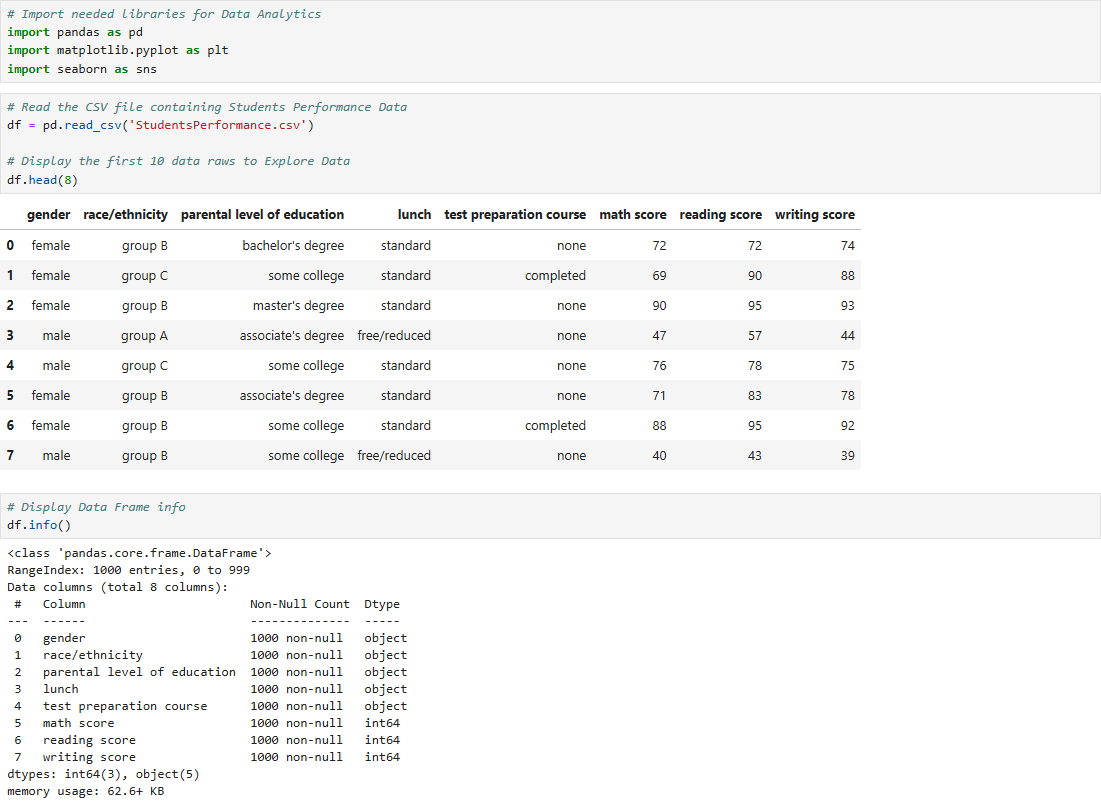
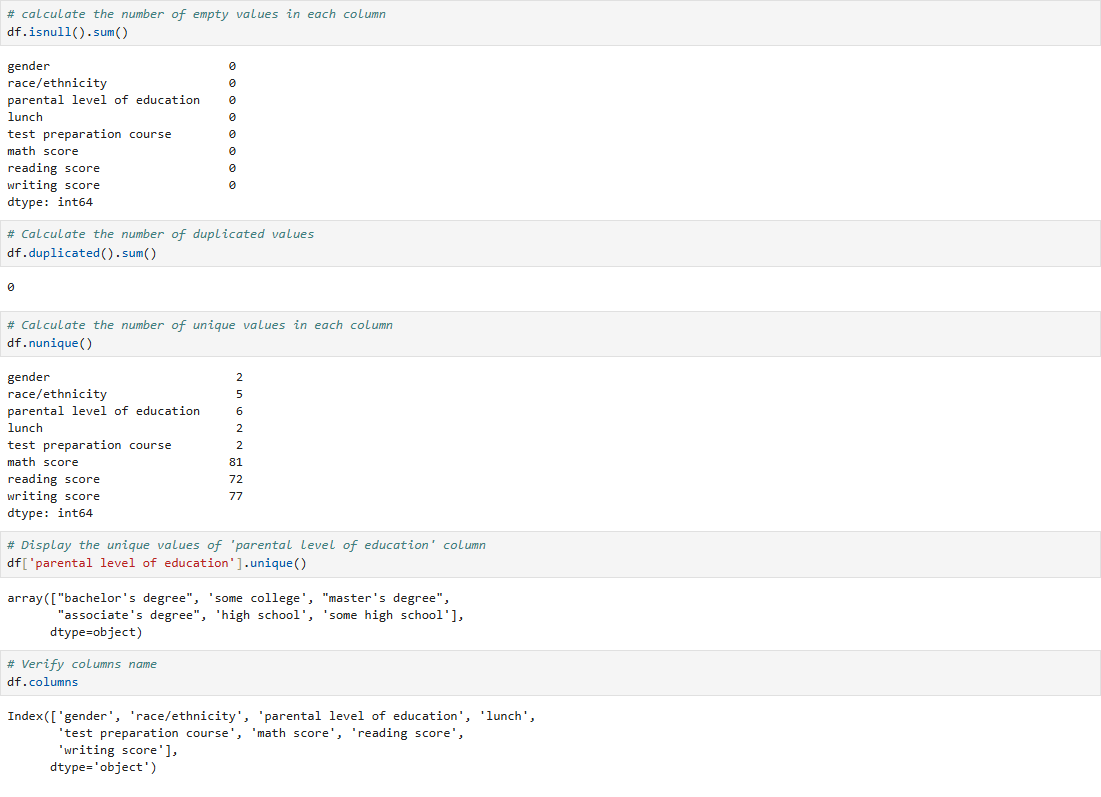
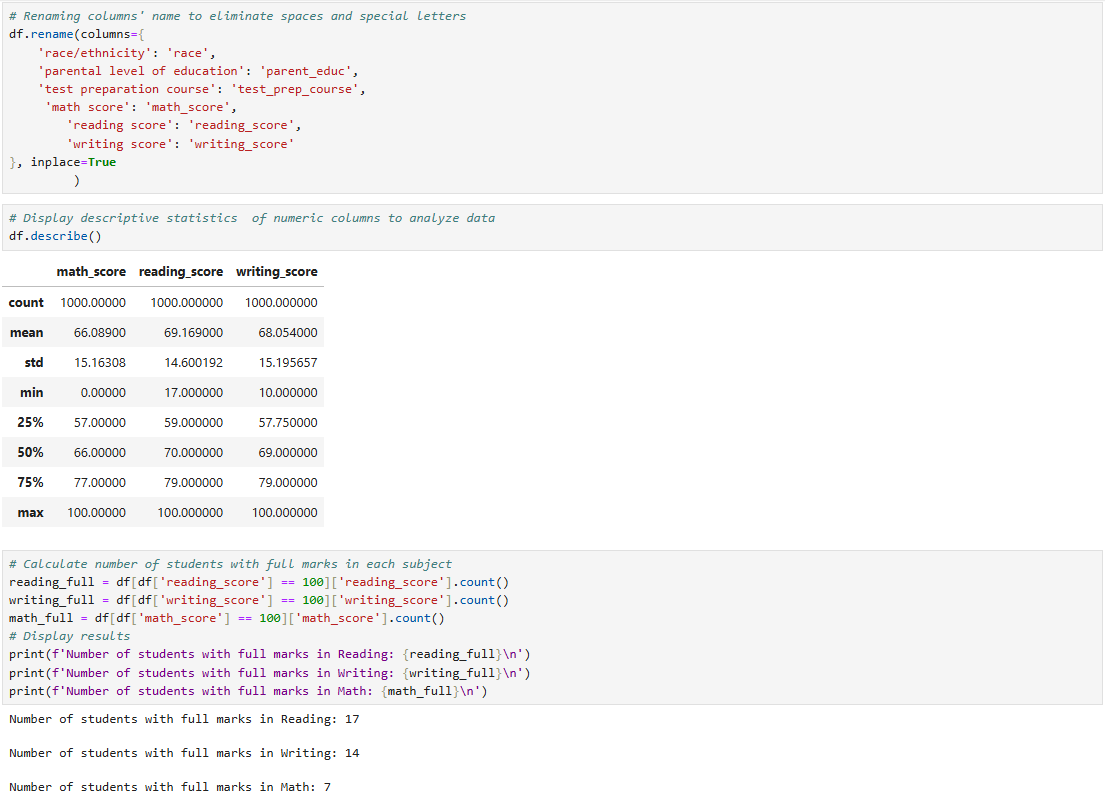
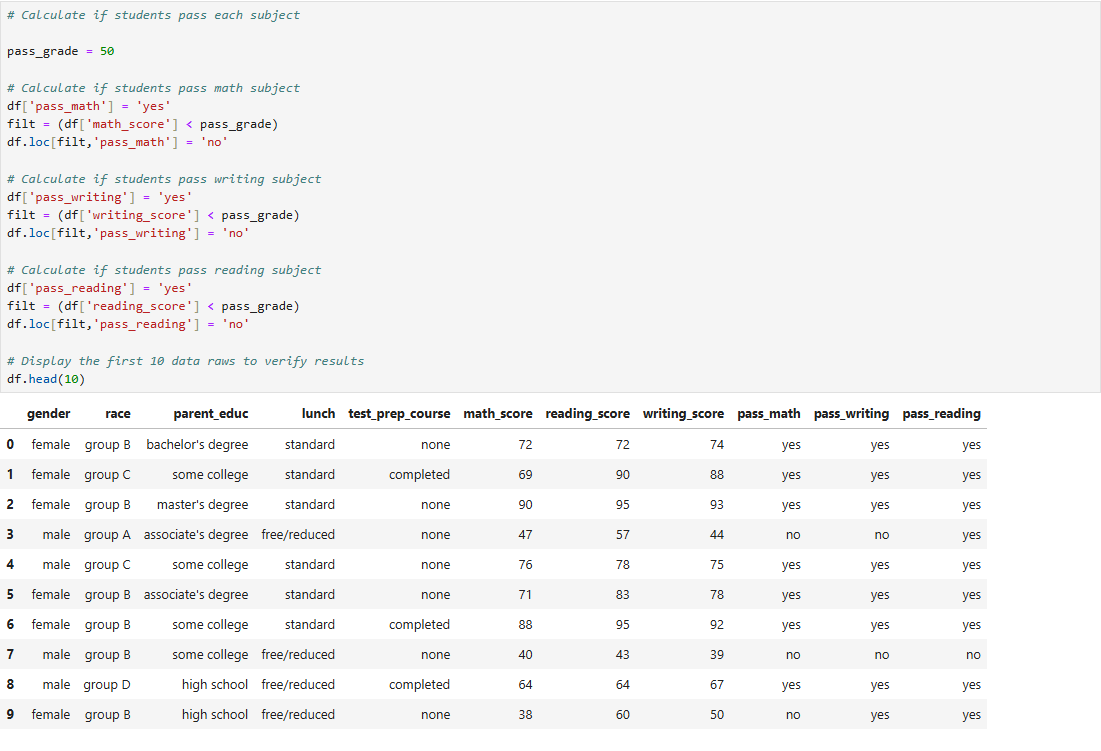
Data Bring & Data Discovery
Student performance Datafile downloaded from Kaggle site.