E-Shop Sales Performance Analysis with the Python Libraries Pandas, Matplotlib and Seaborn (on Open Data)

Goal

 
  • Analyzing E-commerce Shop Sales Performance (from open data), from Data Processing and Cleaning to Data Visualization, with the Python libraries Pandas, Matplotlib and Seaborn.

Result

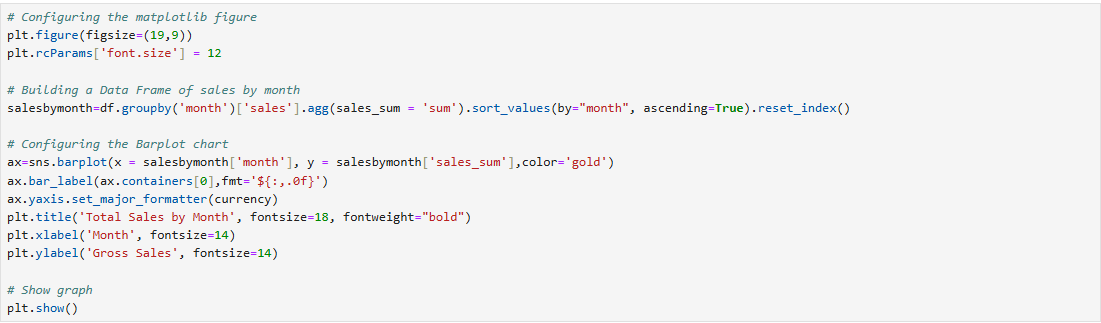
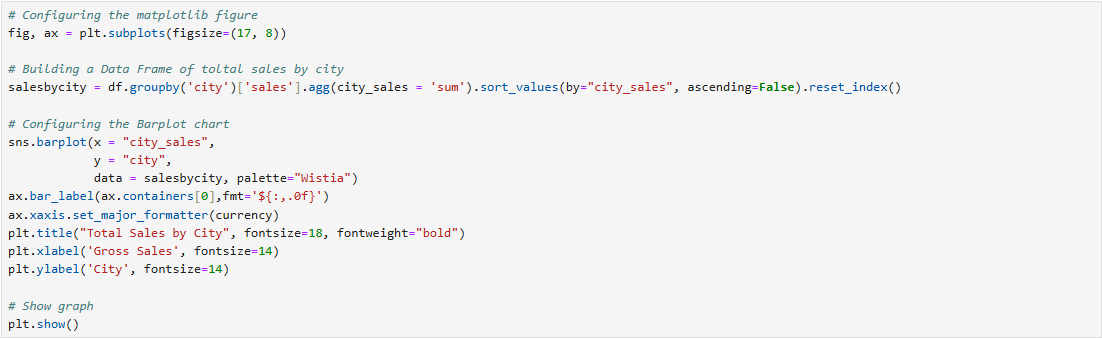
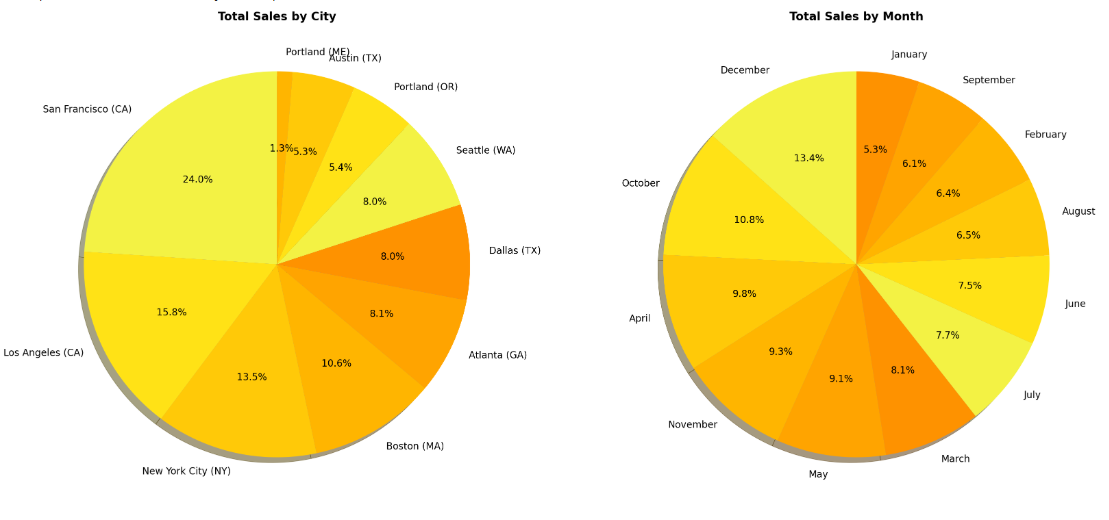
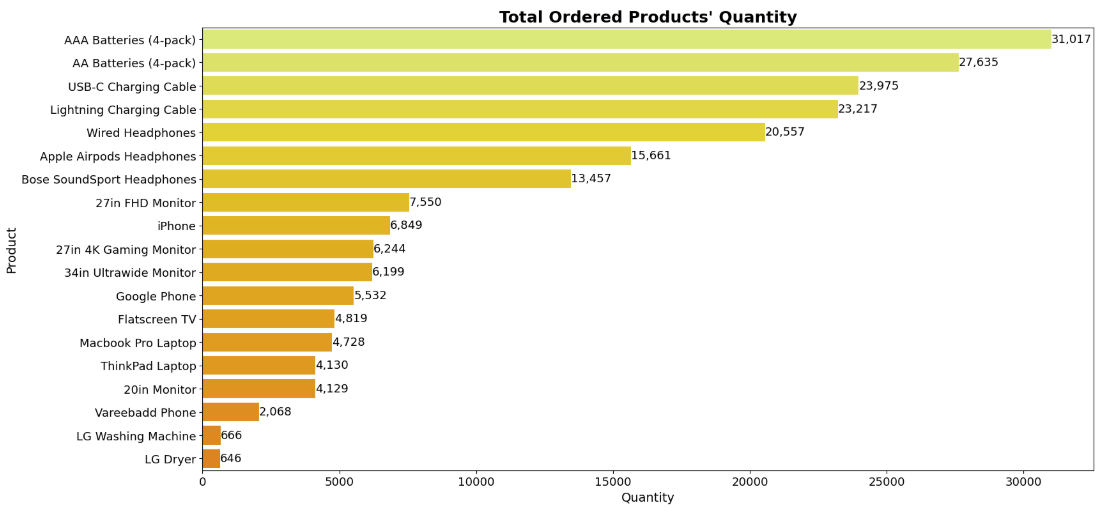
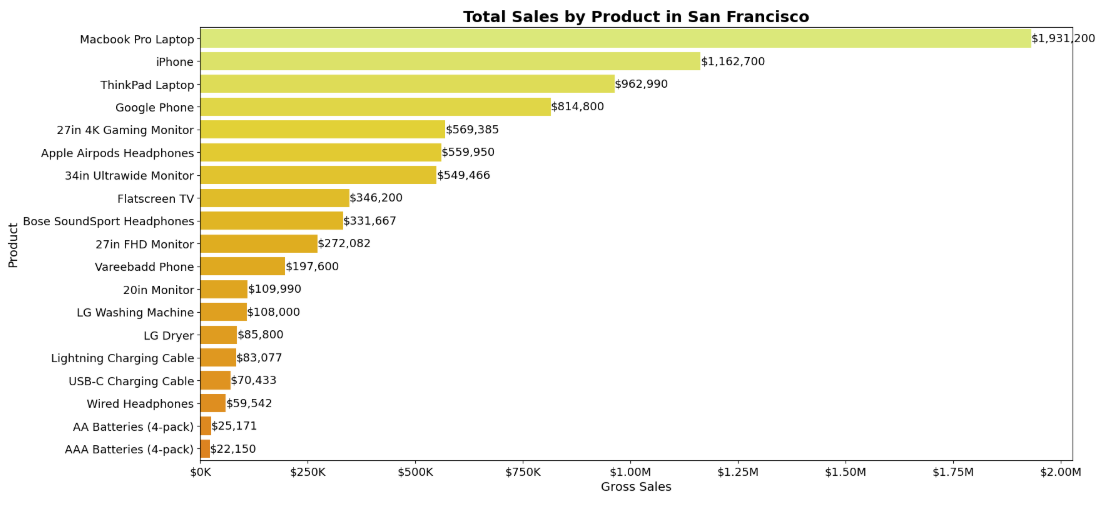
  • Several Visualization Charts (Histogrammes, Pie charts, Barplots ect) Analyzing in detail the Ecommerce Shop Sales Performance:

           * Total Gross Sales by Month

           * Total Gross Sales by City

           * Pie Charts on several Sales Statistics

           * Total Gross Sales by Hour

           * Total Gross Sales by Product

           * Daily Gross Sales in December

           * Total Quantities of Ordered Products

           * Total Gross Sales in San Francisco by Product

           Ect.

Examples of the work done
Total Gross Sales by Month
Total Gross Sales by City
Pie Charts on several Sales Statistics
Total Gross Sales by Hour
Total Gross Sales by Product
Daily Gross Sales in December
Total Quantities of Ordered Products
Total Gross Sales in San Francisco by Product

Details

Data Bring & Data Discovery
  • Sales Data files downloaded from Kaggle site. 
Data Analysis & Data Cleaning